
Real-time Lab of the Energy Transition
For the interactive experience of a climate-friendly power system operation from the low to the extra-high voltage levels, researchers of the Department for Sustainable Electric Networks and Sources of Energy (SENSE) of TU Berlin created a novel laboratory platform. This system is ready to provide students with a first-hand insight into today’s and tomorrow’s grid operation, and it facilitates research into the grid operation of the future.
As Flavio Gromann clicks the mouse, the laboratory network responds with a sound click of its own. Click-clack. Gromann just connected the network of TU Berlin’s Smart Grid Laboratory to the city’s urban distribution grid, activating a power source to the laboratory network. Click-clack: the first consumer, a single-family home, connects to the network. The sound of the mouse is followed by a metallic noise, like that of a heavy electric switch. Click-clack: now the battery unit is connected, too.
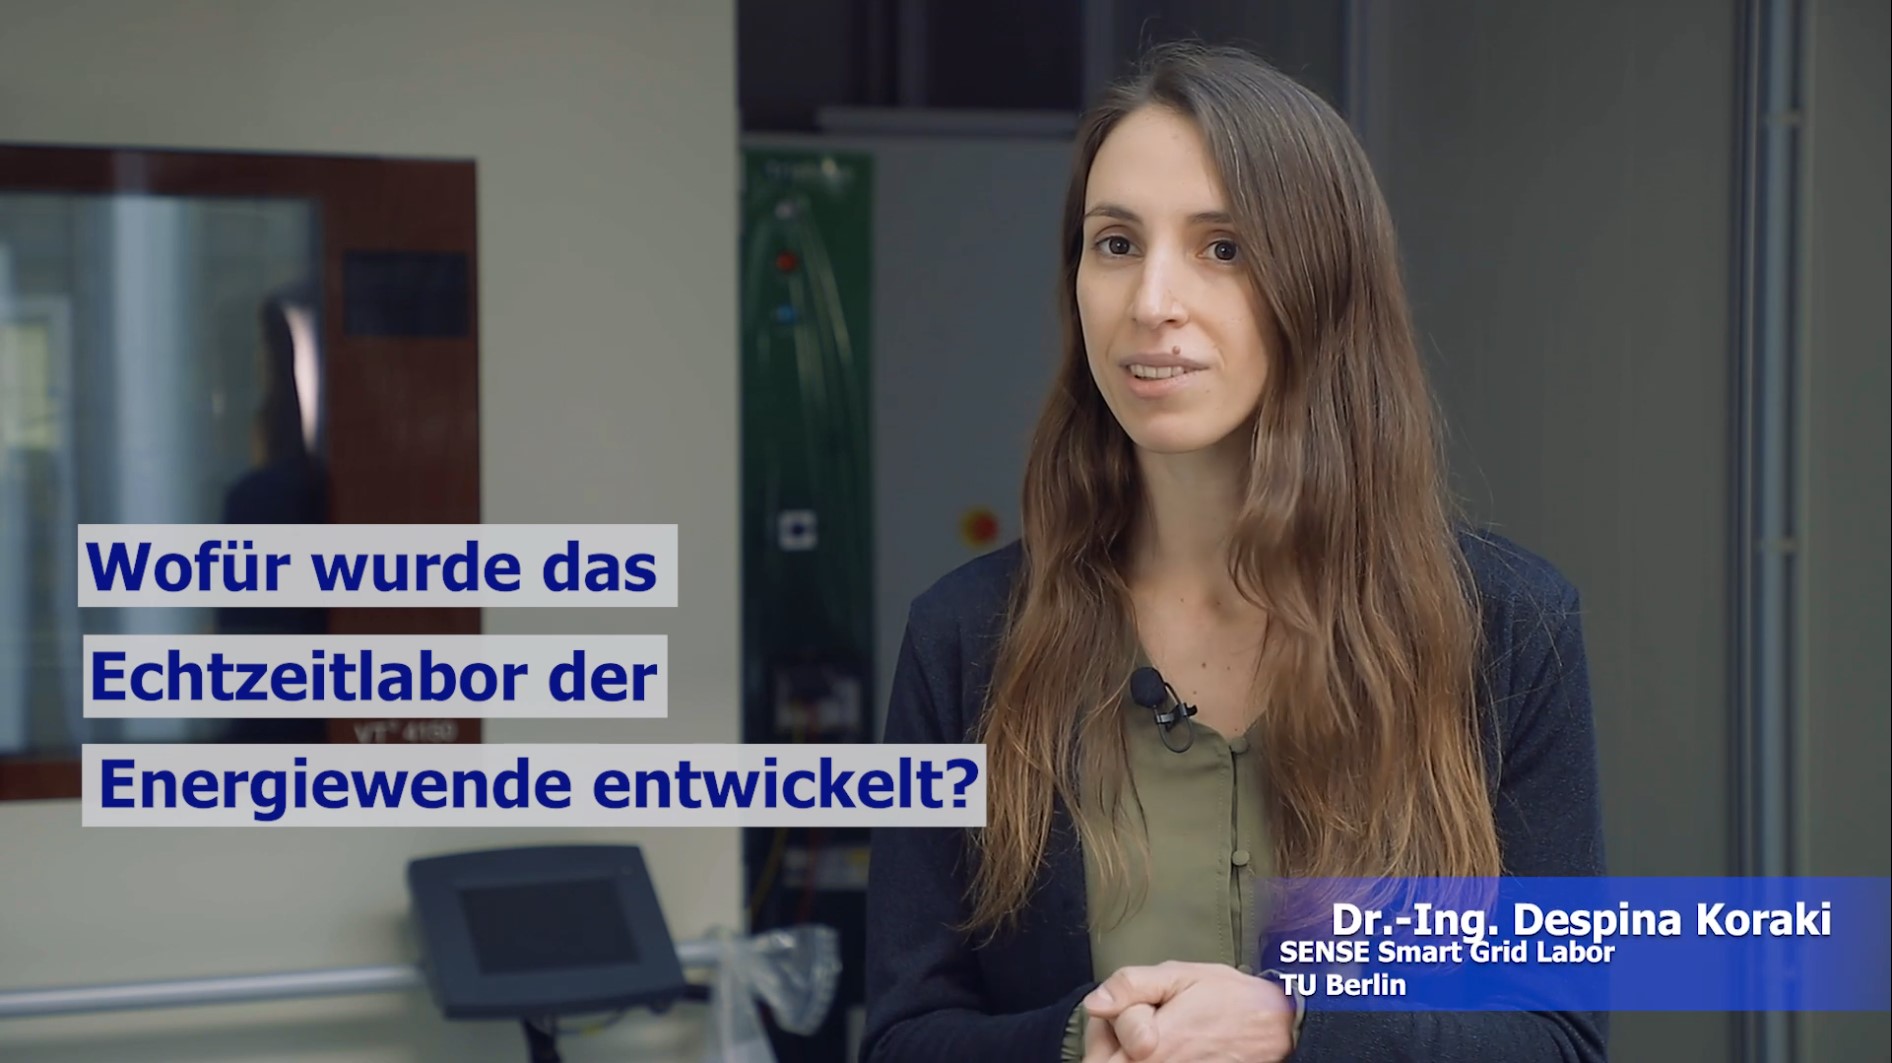
On the large video wall of the Smart Grid Laboratory, Flavio Gromann puts resources into service one by one. Doctoral student Gromann (topic: optimisation and control of energy systems of electricity, heat/cooling, and mobility sectors) and his colleague Dr. Despina Koraki co-ordinate the “Real-time Lab of the Energy Transition” initiative as part of the WindNODE project.
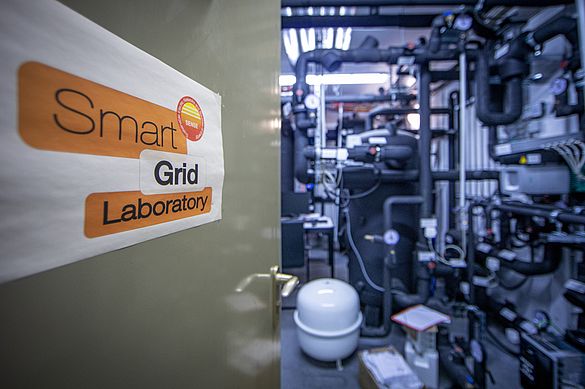
TU Berlin’s Smart Grid Laboratory is the foundation on which they elaborated upon: under the ceiling of the laboratory and through office spaces of the Department of Sustainable Electric Networks and Sources of Energy (SENSE), cables as thick as arms were laid. Here, on the ground floor and in the basement of the university building, they serve as the interconnectors of an electric power network with battery units, an entire series of switchable refrigerators and boilers, a PV system, charging stations, and a heat pump. The power cables run through the walls and branch off towards man-high
beige metal boxes in various rooms of the department. The boxes look like large control cabinets: these plug-and-supply stations make the ‘clack’ when they connect the different sources and loads to the laboratory network. They also include the measurement devices that allow Flavio Gromann to permanently monitor the electric currents and voltages of the individual cables. Next door, in the large testing hall, there are a charging station for electric cars, a battery testing station, and a test rig of a decentralised wind energy conversion system. A nearby sign reads: ‘Do not touch the non-insulated parts. Danger of death!’
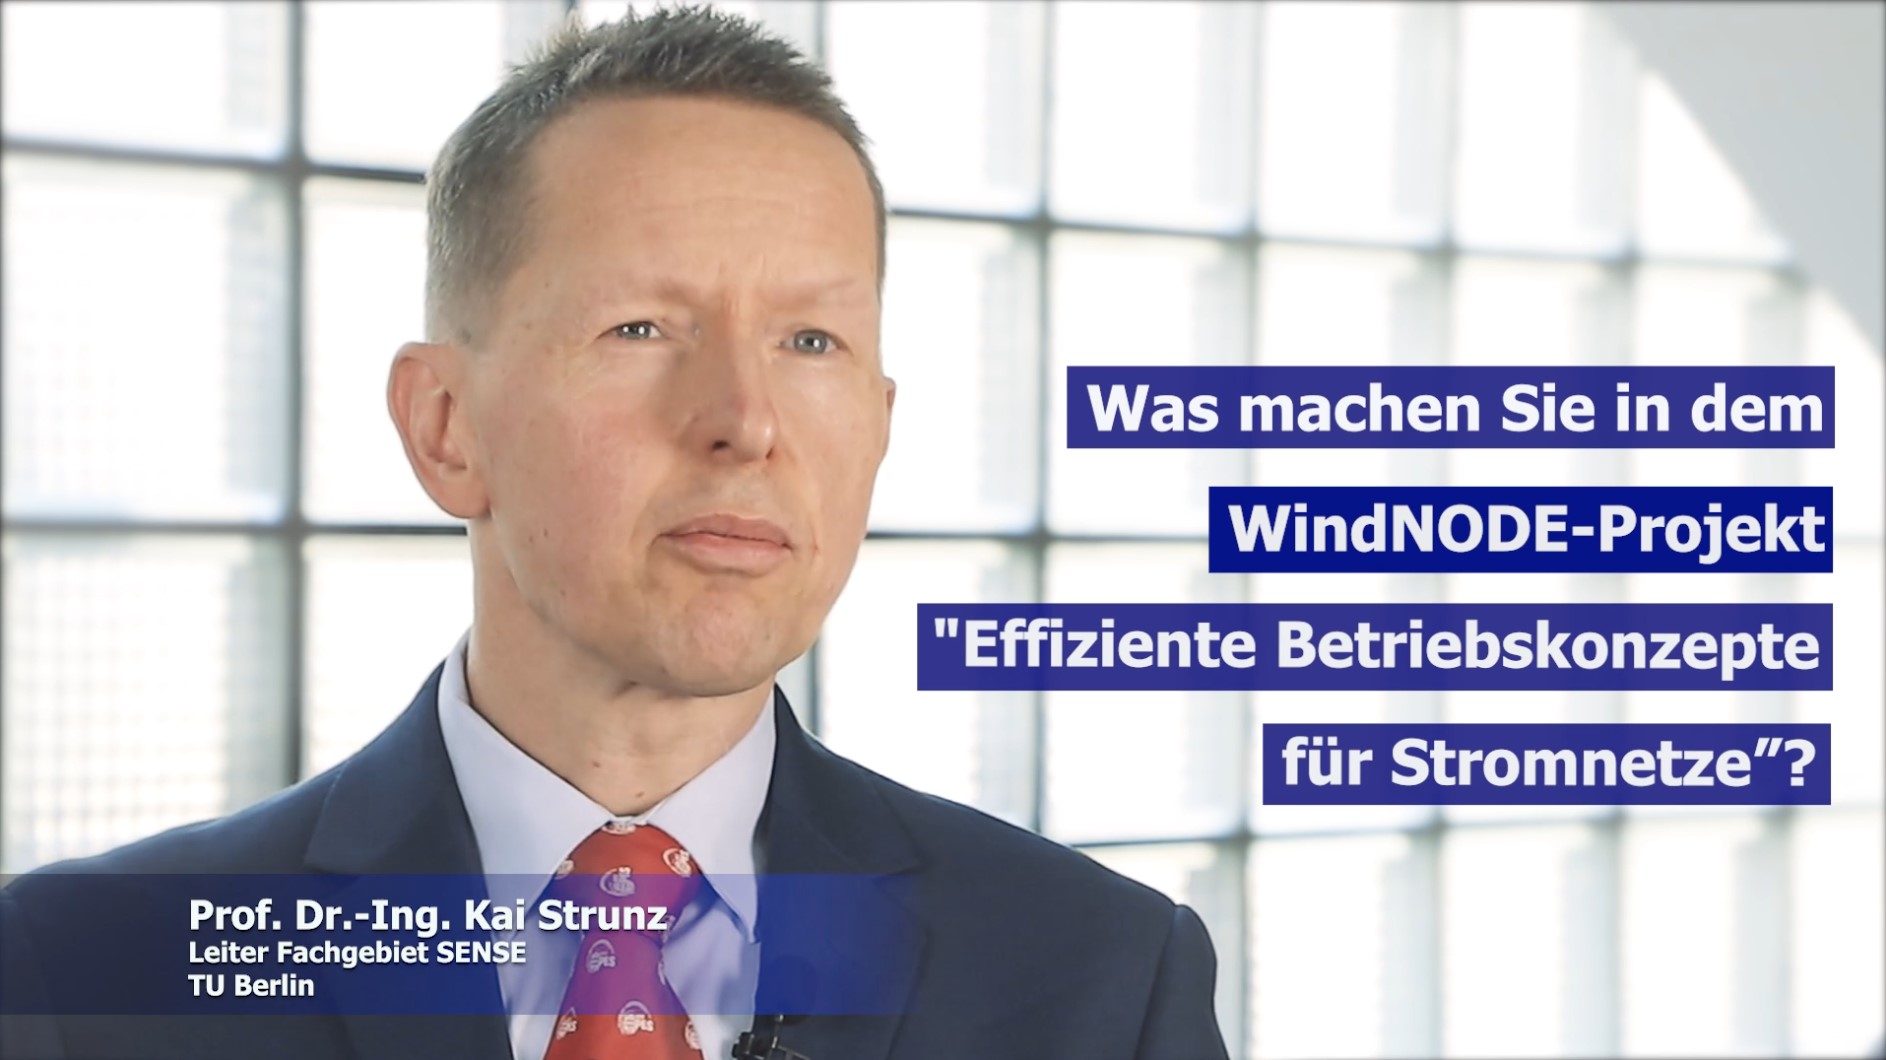
‘Here, we did realize the last 100 meters of a next-generation low-voltage distribution network.’ Professor Kai Strunz explains the interaction of lines, consumers, and generators as they also emerge in real-world mixed residential-commercial urban neighbourhoods. Dr. Maren Kuschke and Stefan Häselbarth of the SENSE department add: ‘In the context of the energy transition, we currently do extend this network section realized in physical hardware, thanks to the “EchtEWende” project, which is also funded by the BMWi (German Federal Ministry for Economic Affairs and Energy). This way, all components will be interfaced via power electronic converters.’ ‘This results in a converter-dominated distribution network.’ As part of the 3rd WindNODE workstream, “Efficient Operation of Power Grids”, the information technology of the laboratory was developed further to engage interested laypersons as well as students and experts in researching the energy transition at varying degrees of detail.
Learn, experience, and explore
‘Learn, experience, and explore’ is the concept of the Real-time Lab of the Energy Transition. Not only is the SENSE laboratory network operated here and filled with life through real-world displays, the visualisation platform also shows the actual distribution network of Berlin, the transmission system in the 50Hertz area of eastern Germany, and the large electric highways between the centers of the European Union.
‘Here, we can simulate and study different states of the network, even for different variants of grid expansion and renewable energy development. We may do so based on today’s grid parameters, but also with the scenarios from the Grid Development Plan for 2030 and even proceed as far as climate neutrality,’ says Kai Strunz. The input data for the simulation and the visualisation mostly rely on real-time data from the laboratory grid, but also cover data from previous days in the national power grid, retrieved from openly accessible grid and weather data, the latter being used to calculate the feed-in from wind farms and photovoltaic systems.
▶ Play
The YouTube video will only load and play after clicking. By clicking the video, you agree to Google's Privacy Policy.
Open-source software from CERN adapted and further developed
At Flavio Gromann’s mouse command, the network ramps up, and a digital map of Berlin appears on the large monitor on the wall of the laboratory and control room, similar to that known from Google Maps. As Gromann zooms in onto the city center, the buildings of TU Berlin appear, followed by the own laboratory building in particular. The map shows lines that one would not find on Google Maps. The hardware ring circuit of the laboratory network appears together with the individually connected loads and storage units. The ring circuit’s measuring equipment collects and presents up to 100,000 current and voltage values per second.
Under normal real-time operating conditions, the present state of the entire network is updated and displayed in seconds. ‘On the user surface, we can continually observe the loadings of the lines and the states of the individual elements,’ says Gromann. In WindNODE, the monitoring and control was realized through an open-source SCADA system.
SCADA stands for Supervisory Control and Data Acquisition, i.e. a software system that collects data from the sensors at the units, transferring them to a central system whilst simultaneously transmitting commands to the units for the purpose of control.
TU Berlin used to have a commercial SCADA system for this purpose, but it came with many disadvantages: each time the department wanted to reconfigure the existing network or to connect new devices, a technician from the software provider had to be booked.
Via WindNODE, the open-source SCADA system C2MON has come into service. The system was originally developed at CERN, where it monitors around 94,000 sensors and distributes real-time data via its many support systems, contributing to a smooth operation of the particle accelerator. C2MON stands for CERN Control and Monitoring Platform.
Software for the seemingly infinite amount of data from the power grid
‘The system is just right for us as we can integrate new units into the laboratory grid without limitation and without major modifications,’ Gromann explains. Thanks to the open-source solution and the ‘formidable cooperation’ with the software developers at CERN, TU Berlin was able to tailor the system exactly to the needs of grid operation. C2MON transmits control and measuring signals from different sources to different recipients with different interface protocols. Optimisation and control algorithms developed in dissertations use this system to control and monitor the devices in the laboratory. Gromann: ‘We envision a software system for power grids that can integrate, monitor, and control a virtually unlimited number of distributed units by means of drag and drop.'
For interested laypersons or student groups, it immediately becomes clear how the grid responds to the utilisation of ever more renewable energy. ‘Visitors can decide which consumers and generators we switch on and connect to the laboratory network,’ says Despina Koraki, who focussed on congestion management and related flexibility in her doctoral thesis.
The colors of the lines depend on their loadings: green for a loading below 50 % of the nominal capacity, orange for lines with a loading between 50 and 70 %, and red for values above 70 %.
From the low-voltage laboratory network to the extra-high-voltage transmission grid
On the large screen, Koraki then leaves the 380-V low-voltage laboratory network and the medium-voltage level of the urban distribution grid in and around TU Berlin. With a few turns of the scroll wheel, she then zooms out to show the wide area of the 380-kV transmission grid of 50Hertz.
The screen now emulates a reality as it otherwise may be encountered in a control room of 50Hertz. In the WindNODE grid area, the major power lines are now pulsating in green, indicating that everything is okay. Under the rich surface, there are data from the previous days where there was a particularly large amount of renewable energy transported over the grid. The software now goes through the day in fast-forward mode and shows 24 hours within 15 minutes.
For this purpose, the TU Berlin team placed two identical – albeit virtual – electric storage units on respectively the northernmost and southernmost points of this extensively used line. By means of a game-based approach, the visitors to the SENSE laboratory can now learn how to make use of such battery storage to relieve the loading on the power line. ‘Our visitors adopt the role of electricity market actors who decide on whether and how many megawatts of power they want to offer with their storage power stations as part of the market process,’ Koraki says. The computer receives the new values and restarts the 24-hour simulation. Now, the line that was previously red is restored to green thanks to the storage intervention. The lesson learned: storage units are capable of stabilising the power grid.
‘This is our most straightforward example,’ Koraki explains. Now, the educational game turns more sophisticated: instead of two equally-sized storage units placed directly at the end points of the overloaded line, the visitors may control two storage units that are at more remote locations; they are to find out soon that the impact of their actions to a large deal depends on the placement of the storage units within the grid. At times, there just is not enough of an impact on the overloaded line. When it comes to power system analysis, it is the term of ‘sensitivity’ that refers to the phenomenon of how pronounced the influence of consumers’ and generators’ locations becomes on an overloaded power line.
Simulation of the power system of tomorrow
From the live experience stage, the visit turns to the stage of exploration and research. Arbitrary lines can be added or removed in the system based on C2MON. On top of this, more storage units, consumers, and renewable energy sources may also be installed and operated. ‘The system becomes ever more sophisticated. Here, we can explore how individual units impact the grid,’ Koraki says.
For an example day, grid overloads at times of high wind power feed-in are noticeable in the WindNODE control area. When taking corrective action, flexibilities come into play, meaning storage units, loads, or generators that can adjust the amount of electric power they feed in or take out.
▶ Play
The YouTube video will only load and play after clicking. By clicking the video, you agree to Google's Privacy Policy.
From the identification of the bottleneck to the procurement of flexibility for congestion management, the SENSE software simulates all steps to compensate the bottleneck, including the acquisition of flexibility via an online platform. The decision for or against flexibilities is not only affected by the prices offered, but also by the sensitivities obtained from the power system analysis as mentioned above.
It is worth noting that the scope of the Real-time Lab of the Energy Transition goes beyond the electric network. It also extends to a part of the district heating network in western Berlin, where there is already a Power-to-Heat (PtH) unit in the Reuter-West power plant
that converts electric power in large continuous-flow heaters. In the visualisation, the continuous-flow water heater can be included there to solve bottlenecks in the electric power grid. At the same time, the temperature variation in the district heating network is simulated. ‘As a result of the energy transition, electric energy and heat supply systems are increasingly intertwined,’ Koraki says. This multi-energy functionality is so also further developed in the project EchtEWende.
The Real-time Lab of the Energy Transition has been planned as a visitor site. During the COVID pandemic, this visitor programme was strongly reduced. ‘Still, more than 150 participants were already able to participate in the simulations with us in 2019 and 2020,’ Koraki explains.
3 questions for…
Mr. Gromann, what does WindNODE offer you?
Gromann: The power network operation is subject to a new paradigm. So far, we have had large power plants that increased or decreased their output depending on the load in the energy system. This is about to change: in the future, we must adjust to the millions of photovoltaic systems and wind energy converters by means of flexible storage units and the shift in demand, as our electric power generation is also weather-dependent. In WindNODE, we were able to make the SENSE research laboratory accessible to interested laypersons, students, and experts from within the energy industry. Here, we can show how the network responds to the fluctuating feed-in of renewable power. We can also demonstrate how we utilise storage units and the demand side right down to individual electric vehicles in order for them to accommodate this new network paradigm.
The digital representation of grids is a standard instrument that can also be found in many grid control rooms of major system operators. What can your grid simulation do that others’ cannot?
In the SENSE department, the digital model of the higher-level grid is directly coupled with a physical distribution network in the laboratory where we so can directly implement controller prototypes. Berlin’s district heating network is also under consideration. We always focus on climate-friendly solutions of 100 % renewable energy. In addition to that, we also use an open-source software, C2MON, in the laboratory. That way, we can adjust our simulation to many imaginable scenarios and be open to novel and innovative ideas.
How can external parties like laypersons or researchers access this simulation in the future?
Our Real-time Lab of the Energy Transition will be open to visitors as part of the “Lange Nacht der Wissenschaften” (Long Night of Sciences) and on three additional dates per year. The dates will be published on the website of the SENSE department.
Visitor site
Real-Time Lab for the Energy Transition
TU Berlin
Department for Sustainable Electric Networks and Sources of Energy (SENSE)
Einsteinufer 11 (EMH-1)
10587 Berlin
Email:
sekretariat@sense.tu-berlin.de